Elliott wave pattern : Double Three (WXY) Structure
August 7, 2016
An Important Lesson on Money Management
August 7, 2016Elliott Wave Triangle Structure
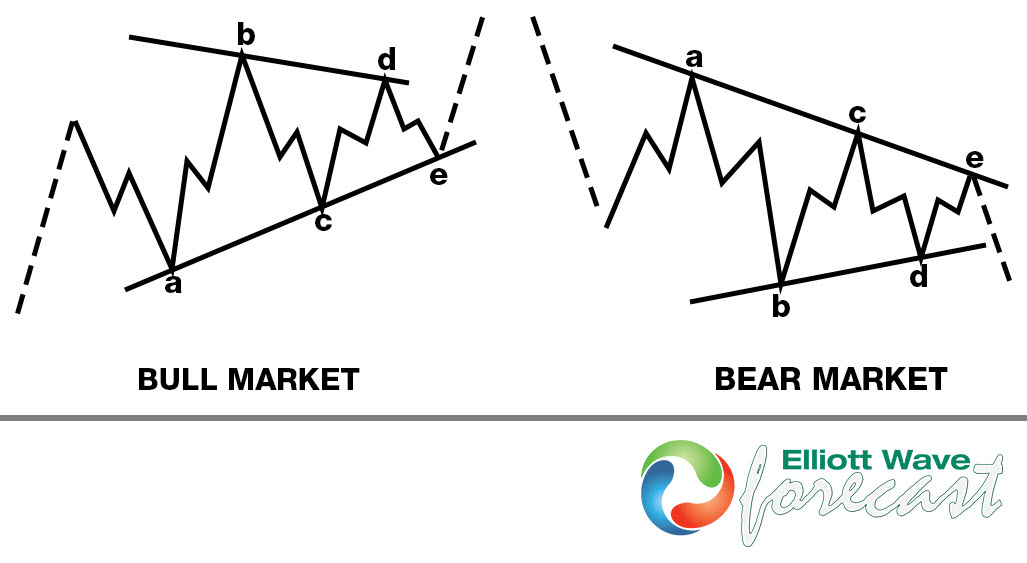
Triangle is an Elliott wave pattern seen during sideways market consolidations, it is composed of 5 corrective sequences. Triangle presents a balance of forces between buyers and sellers, causing a sideways movement that is usually associated with decreasing volume and volatility. This pattern subdivide into 3-3-3-3-3 structures labeled as A,B,C,D,E.
Triangle is continuation pattern which breaks in direction of the preceding move. It could occur in wave 4 in an impulsive structure, wave B in a zig-zag and wave X connector in double and triple threes Elliott wave structures. It could also occur in wave Y of a WXY structure in which case it marks the end of correction.
Note: Triangle must be supported in RSI indicator as well and it never happens in wave 2 of impulsive structure.
Many wavers ignore the importance of decreasing momentum in a triangle formation. We at EWF use RSI to filter out other types of sideways consolidations. We like to see contracting formation in RSI as well when looking at a triangle formation.
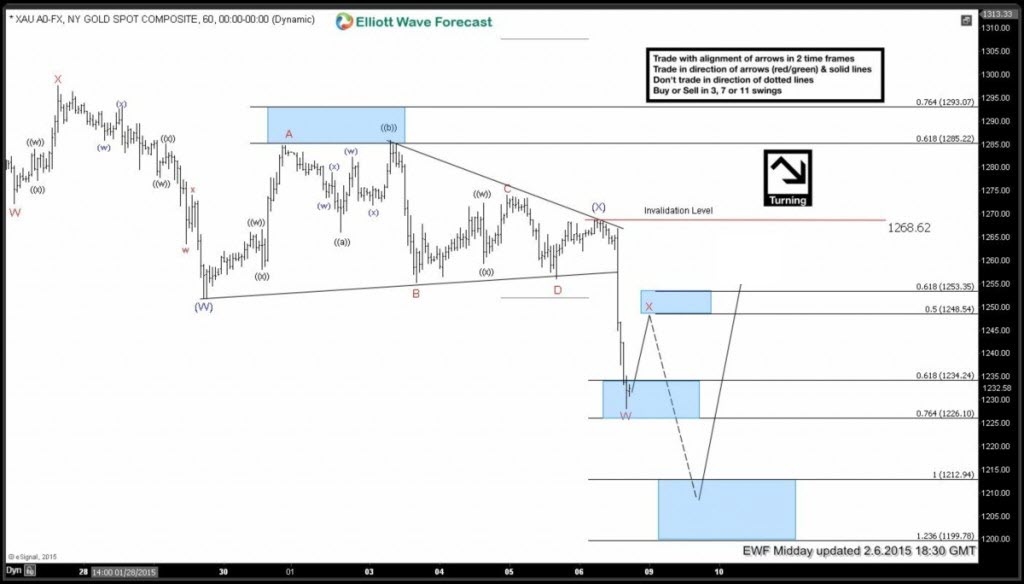
The following chart shows how Elliott Wave Triangle looks like in real market.
$GOLD 2.6.2015 update (X) connector has done as Triangle structure ,which is composed of 5 waves A,B,C,D,E.
All of them are corrective structures and each one is shorter than previous one. Target area for ending point of triangle is usually 61.8-76.4 fibonacci retracment of wave C or 61.8-76.4 fibonacci extansion of C related to D.
After wave E retraced toward 61.8-76.4 fib zone, we got sharp decline in direction of pevious trend. When the price broke below D low, we got confirmation that Triangle has ended at 1268.62.
Access Free Daily Elliott Wave Forecasts in Chart Of The Day section
If you would like to have access to EWF charts in real time and learn from Market Experts, feel free to join us. Now you have an opportunity to sign up for 14 Days Trial and get a Full access of Premium Plus Plan in 2 weeks. We provide Elliott Wave analysis in 4 different time frames, 2 live webinars by our expert analysts every day, 24 hour chat room support, market overview, daily and weekly technical videos and much more.
If you are not member yet, just sign up here to get your 14 days Premium Plus Trial. Welcome to Elliott Wave Forecast !


