Fundamental Trade-able??
August 7, 2016
Sideways Price Action – First Stages of a Triangle
September 12, 2016Equal Legs Price Measurement
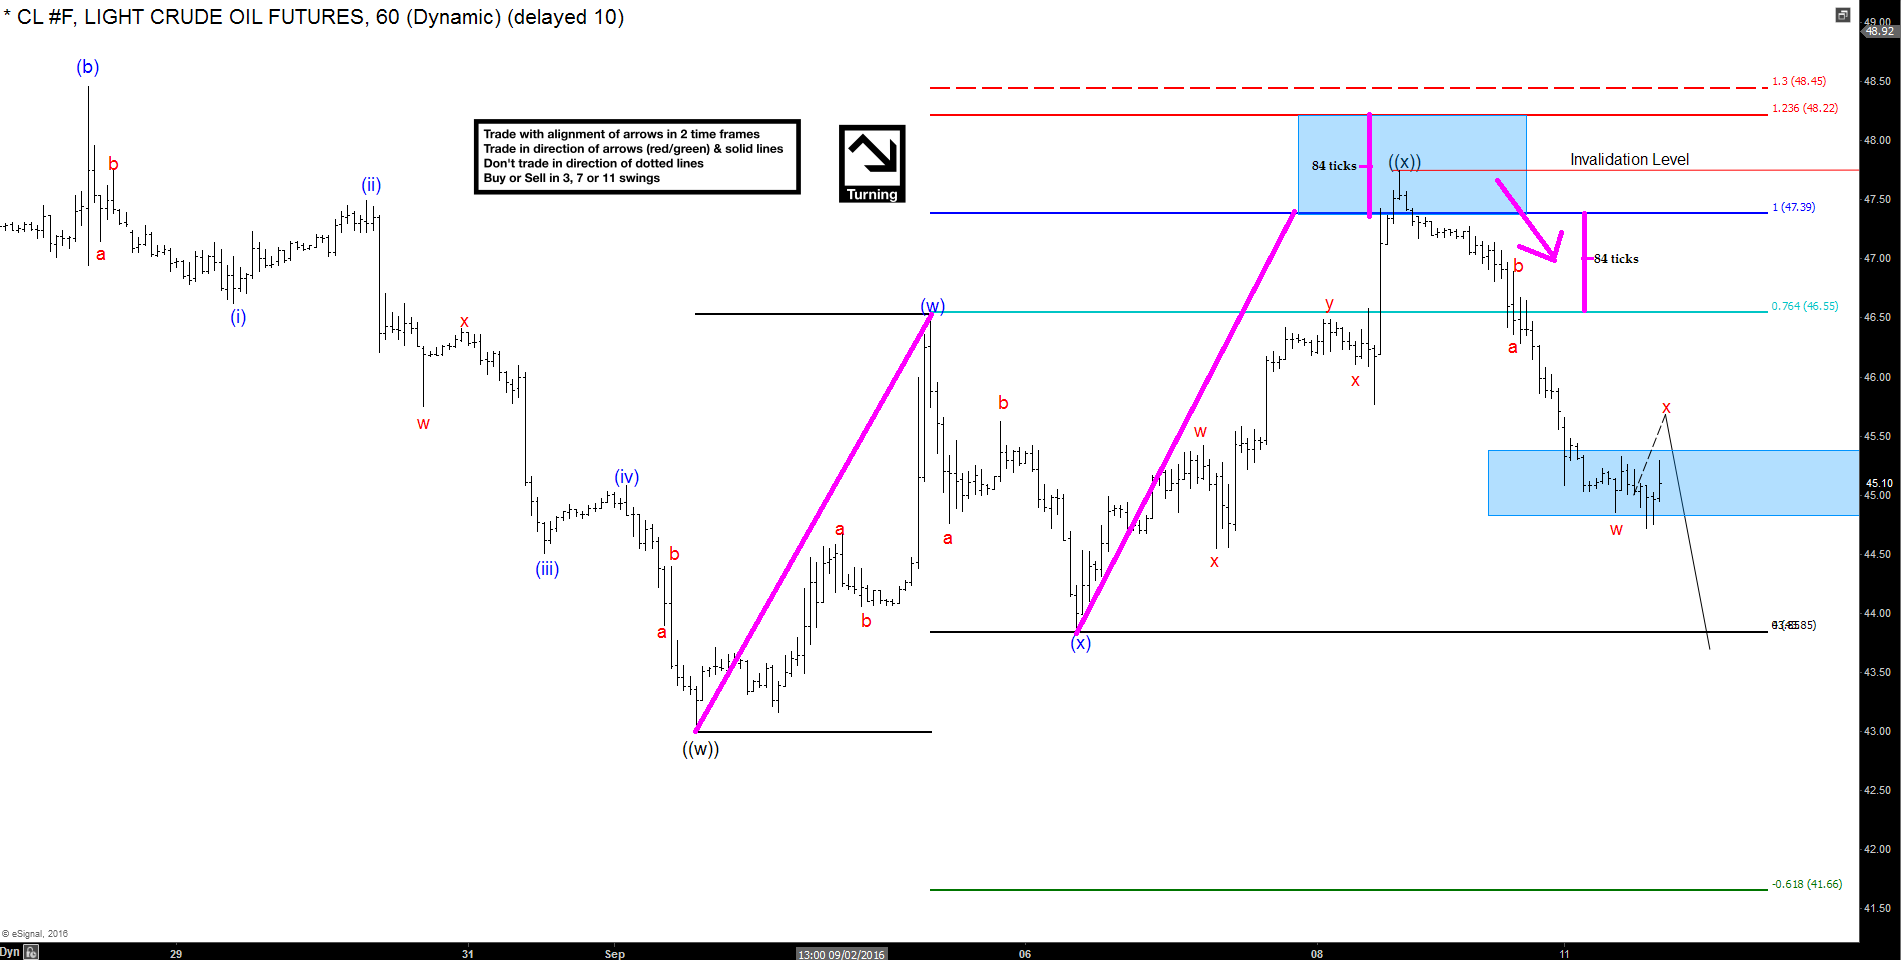
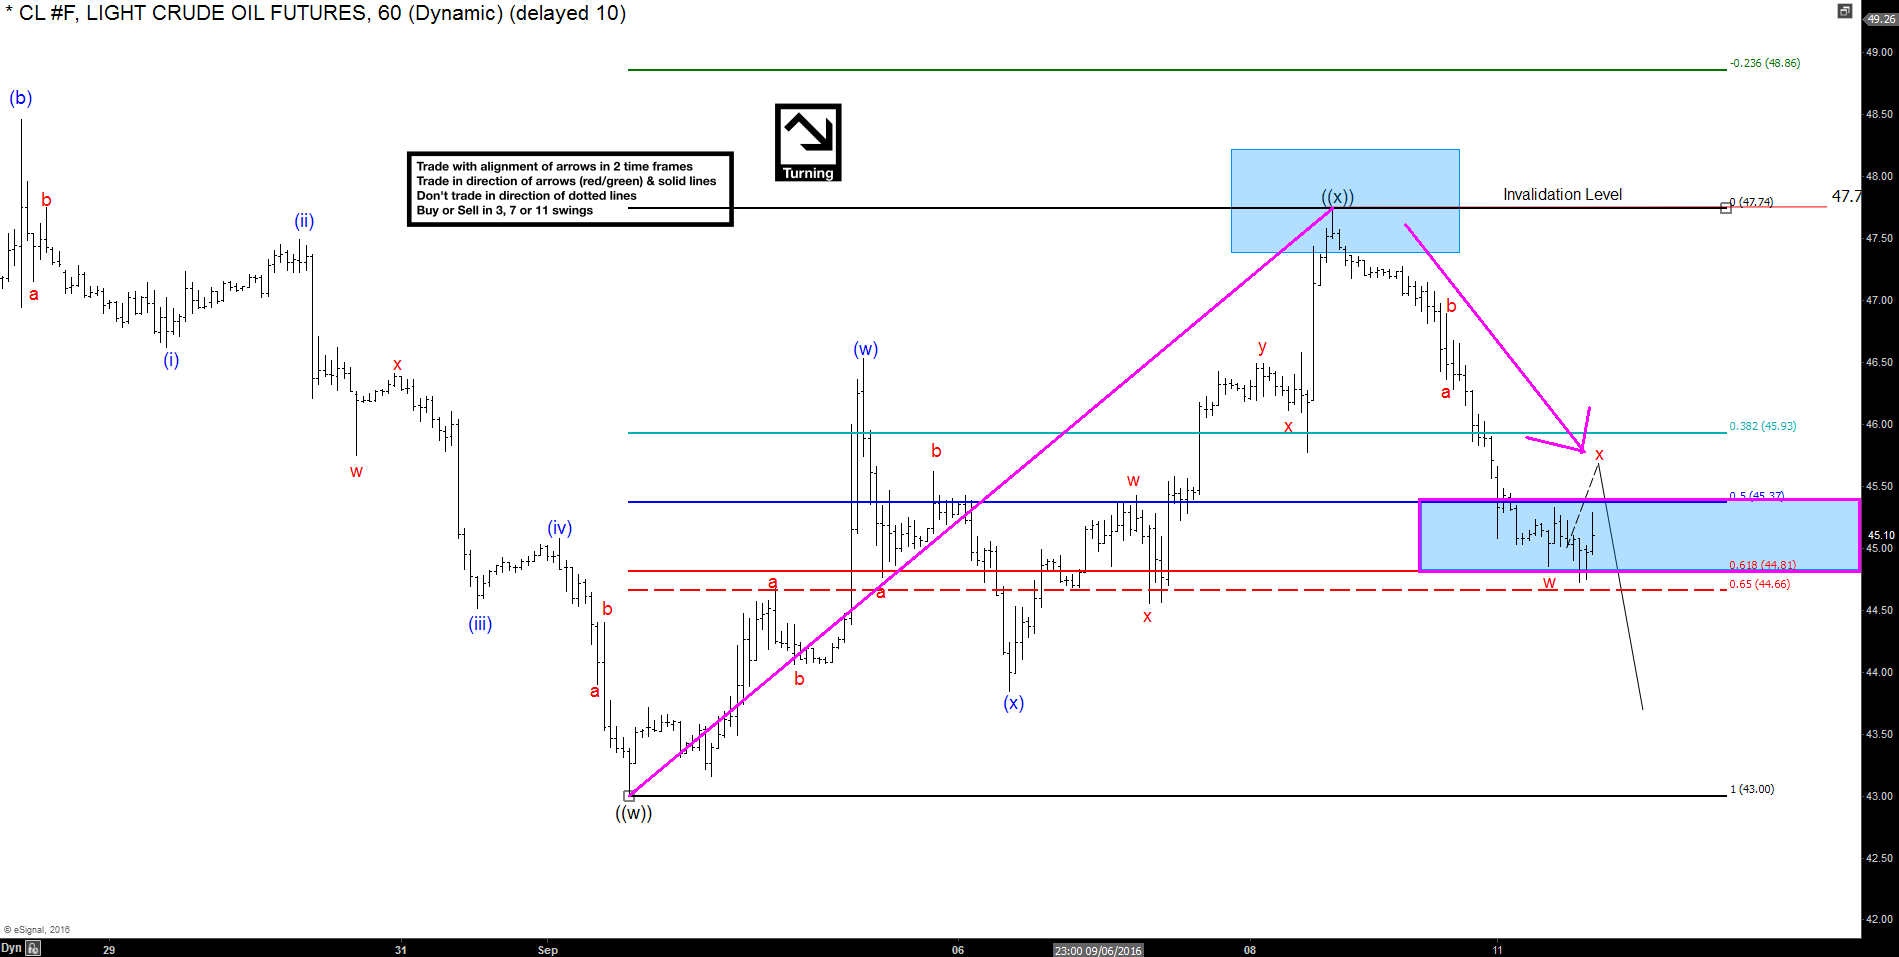
Price measurement is one of the easiest ways to identify trading possibilities. We can use it to identify trend, trend reversals, potential targets, stops, entries and much more. One of my favorite tools is the Fibonacci Extension Price Measurement. This tool is very similar to the Fibonacci Retracement tool in that it utilizes the golden ratio and the Fibonacci sequence to determine pattern in price measurement. This is however, where the similarities end. The Fibonacci Extension tool is used to measure a price projection (as shown in figure A) rather than a retracement (as shown in figure B).

Figure A
In this example I have taken from the CL (WTI Crude Oil Futures Contract) 60 min chart, the Fibonacci Extension Tool is used to measure a three wave Elliott Wave Structure that began from black ((w)) lows. The two waves being measured are waves ending blue (w) and (y) [black ((x))], with the blue (x) wave connecting them. The magenta lines are the two legs of this structure that are being compared. Traditionally in a three legged Elliott Wave three structure, we utilize the 100% line of the Fibonacci Extension tool as an indicator for a short term price reversal, and we call this area of price measurement the inflection zone.
The trading setup I am showing indicated a resistance zone starting at the 100% fib (dark blue solid line), continuing all the way through to the 123.6% fib (red solid line). From there we anticipated a reversal in the near term back towards the 76.4% fib (light blue solid line) to confirm the initial reaction, this is the markets inflection.
Now that we have determined a point of inflection in the market, we should look for a place to exit the trade. I often use an opposing Fibonacci retracement (Figure B), as my exit. In this measurement I am looking for the 50% fib (dark blue line in Figure B), of the entire rally, to take my position off and book my profits. The trade does not rely on new lows, or a large swing to be successful, merely the reaction of the market from a well-defined Fibonacci inflection zone (in this case, the 100% equal legs).

Figure B
If you are interested in learning more about trading strategies, developing the trading plan that is right for you, or just have any questions or comments, feel free to contact the Elliottwave Forecast Educational Team!
