
Elliott Wave Theory Structure : A Running Triangle
August 7, 2016Interview with Eric Morera: ABC (Zig-Zag) Elliott Wave Structure
August 7, 2016$AUDUSD Expanded Flat Pattern
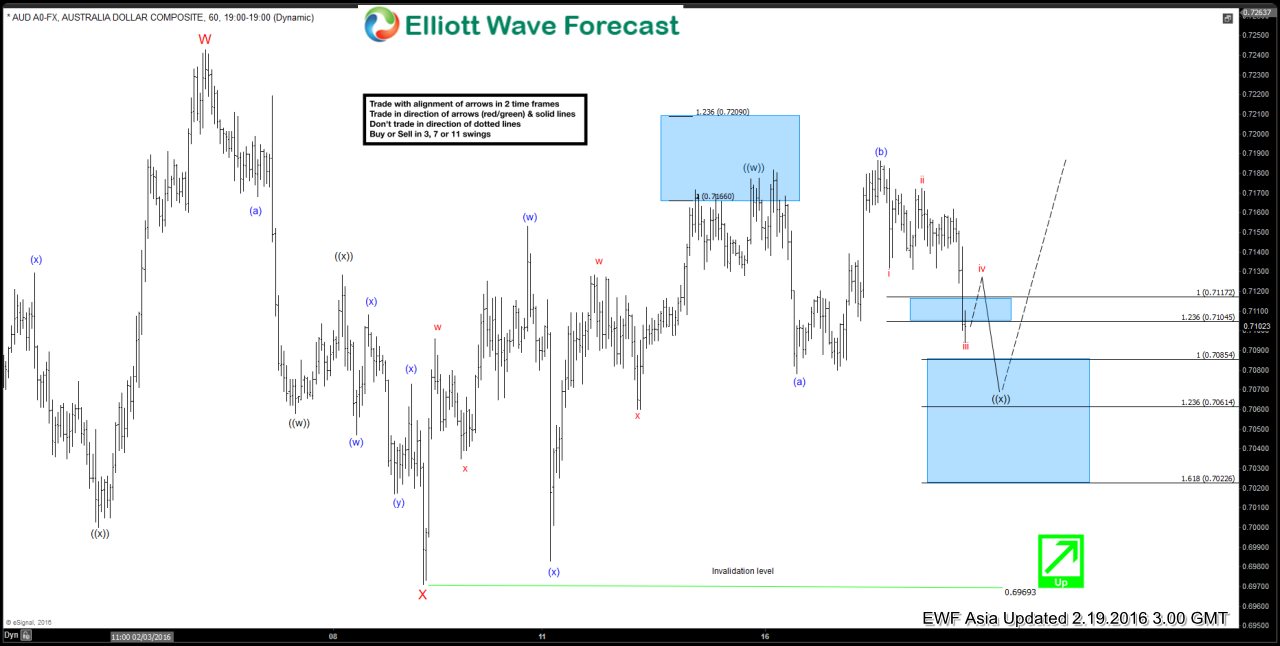
The $AUDUSD chart below shows forecast from February 19 2016. It suggests the cycle from the 0.69693 short term low has not done to the upside yet, calling for further extension above the previous W high : 0.7242. The pair ended first leg wave ((w)) of Y red at 0.7171 and now it’s showing very interesting price structure, as it broke above the ((w)) high, made new peak at 0.71852 – wave (b) , and turned lower shortly after. While it was pushing lower, it broke the previous short term low at 0.708- wave (a)
These kinds of movements are nightmares for some traders who play breakout strategies, pushing them constantly out the trades. Elliott Wave Practitioners are familiar with this pattern and they recognize it as Expanded Flat (which could often be seen nowadays in the market). We at Elliott Wave Forecast can spot such patterns early by looking at the structure of internal subdivision, looking at price distribution and using market correlation strategies.
The chart below shows ((x)) correction is expected to take the form of Expanded Flat structure and complete between 0.70854-0.70614 area, looking for turn higher above the mentioned 0.7242 level.
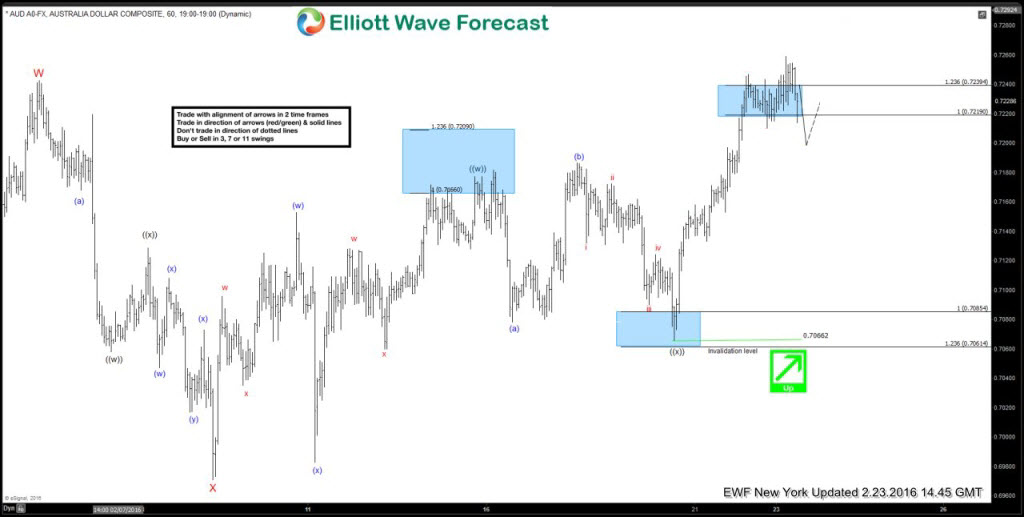
2.23.2016 New York h1 Update $AUDUSD found buyers at 0.70854-0.70614 area as expected. The pair completed wave ((x)) pull back at 0.70662 low as Expanded Flat Structure and turned higher qickly, breaking the W high at 0.7242
In further text we’re going to talk a little bit about Expanded Flat Pattern, but before we continue, here’s a short reminder: check out New EWF blogs and Free Elliott Wave charts.
Expanded Flat is a 3 wave corrective pattern which could often be seen in the market nowadays. Inner subdivision is labeled as A,B,C , with inner 3,3,5 structure. That means waves A and B have forms of corrective structures as well as zigzag, flat, double three or triple three. Third wave C is always 5 waves structure, either motive impulse or ending diagonal pattern. At the graphic below, we can see what Expanded Flat structure looks like.
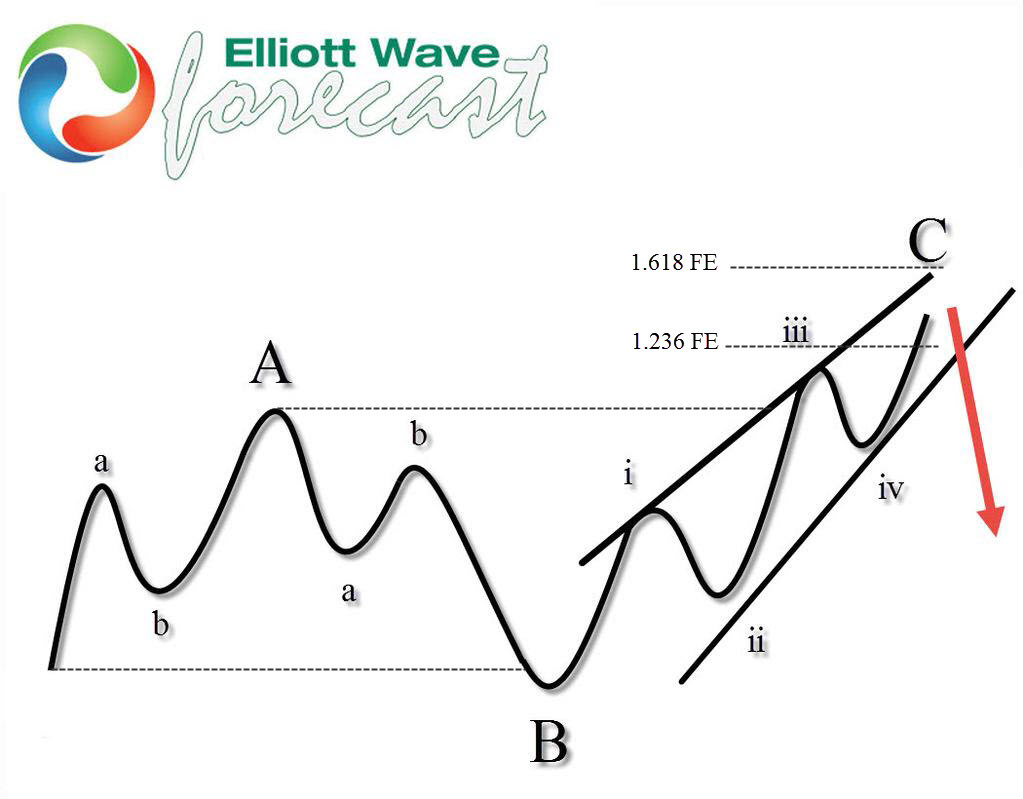
It’s important to notice that wave B completes below the start point of wave A, and wave C ends above the ending point of wave A which makes it Expanded. Wave C of expanded completes usually close to 1.236 Fibonacci extension of A related to B, but sometimes it could go up to 1.618 fibs ext.
Proper Elliott Wave counting is crucial in order to be a successful trader. If you want to learn more on how to implement Elliott Wave Theory in your trading and to learn more about next trading opportunities in the Market, try us free for 14 days. You will get access to Professional Elliott Wave analysis in 4 different time frames, Daily Elliott Wave Setup Videos ,Live Trading Room and 2 live Analysis Session done by our Expert Analysts every day, 24 hour chat room support, market overview, weekly technical videos and much more…
If you are not member yet, use this opportunity and sign up now to get your Free 14 days Premium Plus Trial.
For any questioning, feel free to contact me through e-mail vlada@elliottwave-forecast.com or in twitter.
Welcome to Elliott Wave Forecast !