Elliott Wave Extensions within a 5 wave move
August 7, 2016
Labeling Elliott Wave Patterns
August 7, 2016Elliott Wave Theory Structure : Double Three with a Triangle Y
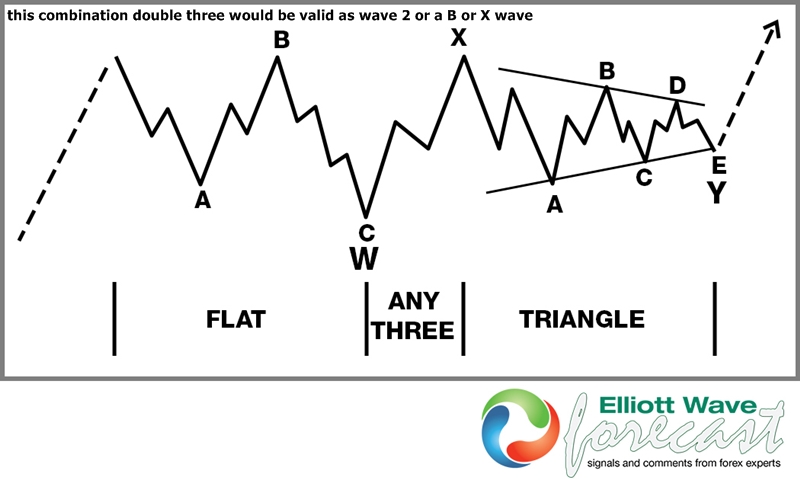
Double three structures in general are common occurrences in the market and as it has been pointed out before they can also be the Elliott wave formation that a particular market instrument is trending in the larger degrees and time frames as it is simply impossible in some markets to get a legitimate impulsive count. That said these may be seen in any time frame or degree. Noted in the graphic below is a bullish example which can be applied inversely for a bearish market condition. The leading dotted line can represent either a wave 1, 3 or 5th of a larger degree (A) as in an impulse. It can also represent a wave Y of (W) of a trending move that subdivides as a WXY double three.
As for the double three correction in the graphic beginning at the solid line it shows an ABC flat W however it is not a requirement for those first three swings to be a flat, as it may be a zig-zag or a 7 swing WXY double three itself however an initial wave W will never be a stand alone triangle. The same can be said of a wave 2 as it will never be a stand alone triangle. Continuing on after the W, the X wave in the graphic may be anything such as a flat, zig-zag, double or triple three structure. It is possible and common to see the X become a triangle however if it is, it won’t be likely the wave Y becomes a triangle. Continuing the solid into the wave Y triangle the first leg in the A should be three larger swings and at the end will represent the low point of the triangle and as mentioned earlier applied inversely to a bearish market it will represent the high point in the triangle. The wave A and B will show the low and high points of the rsi indicator reading as well as low and high points in price with the wave C, D & E contracting smaller each swing in both rsi and price until it reaches it’s terminus and ends the double three corrective cycle which after completion can be labeled as the next larger degree wave 2,4,B,X or Y . Afterward the market resumes the previous trend in the dotted line.
Thanks for looking and feel free to come visit our website and take a trial subscription and see if we can be of help.
Kind regards & good luck trading.
Lewis Jones of the elliottwave-forecast.com Team