February 2, 2017

Elliott Wave Theory is a form of technical analysis to analyze financial market cycles and forecast trends. It is named after Ralph Nelson Elliott (1871 – 1948). Inspired by the Dow Theory and by observations found throughout nature. Elliott concluded that the movement of the stock market could be predicted by observing and identifying a repetitive pattern of waves. Elliott noted from his observation that movement in the direction of the trend is always in five waves, labelled as 1, 2, 3, 4, and 5. This is usually called motive wave. Movement against the trend is always in three waves […]
September 12, 2016
The triangle is an often elusive price structure that most traders do not notice until its too late! In this video, I take you through the first stages of a triangle or sideways market price action in order to better prepare you for the incoming chop. The better you are at identifying when a market is susceptible to sideways price action, the easier it will be to adapt your trading for it. Trend following strategies often get beaten up in such scenarios, so learning to identify choppy price action early will save you your hard earned pips in the long […]
August 7, 2016
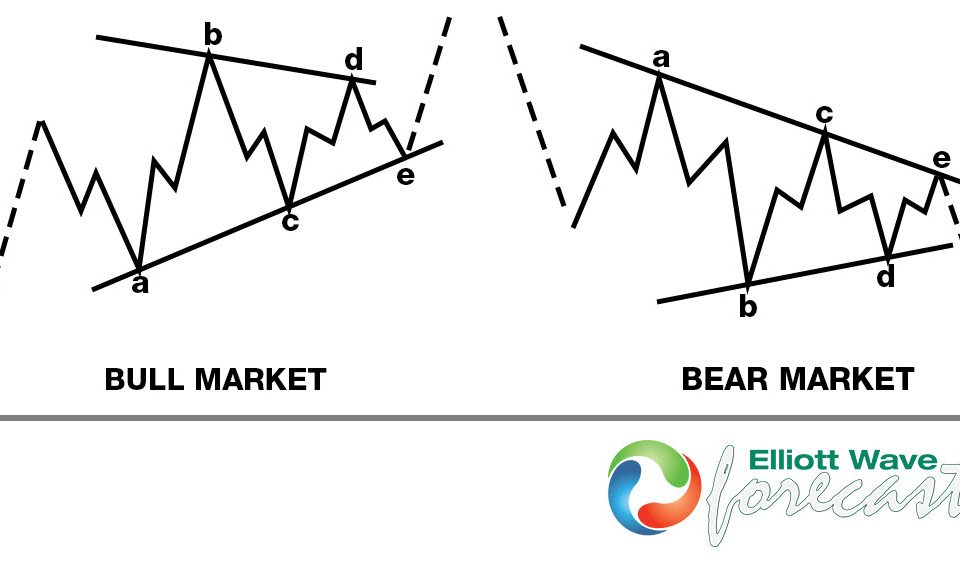
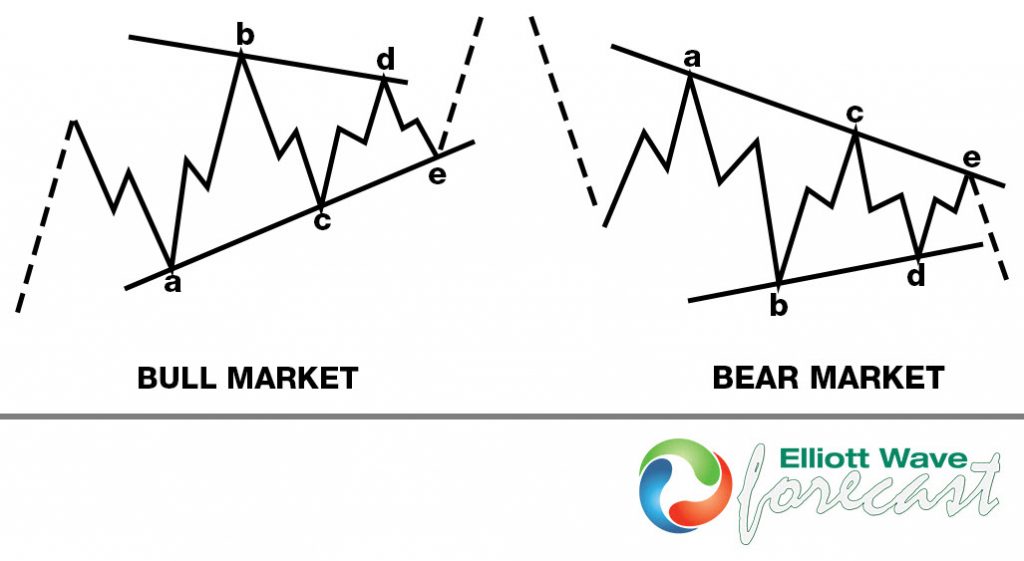
Triangle is an Elliott wave pattern seen during sideways market consolidations, it is composed of 5 corrective sequences. Triangle presents a balance of forces between buyers and sellers, causing a sideways movement that is usually associated with decreasing volume and volatility. This pattern subdivide into 3-3-3-3-3 structures labeled as A,B,C,D,E. Triangle is continuation pattern which breaks in direction of the preceding move. It could occur in wave 4 in an impulsive structure, wave B in a zig-zag and wave X connector in double and triple threes Elliott wave structures. It could also occur in wave Y of a WXY structure in which […]
August 7, 2016
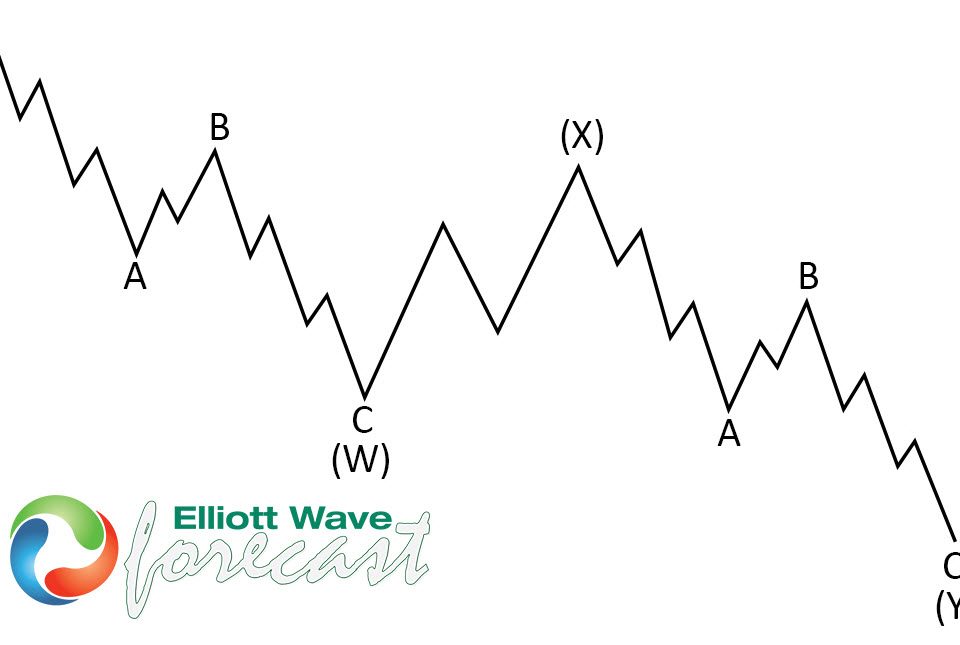
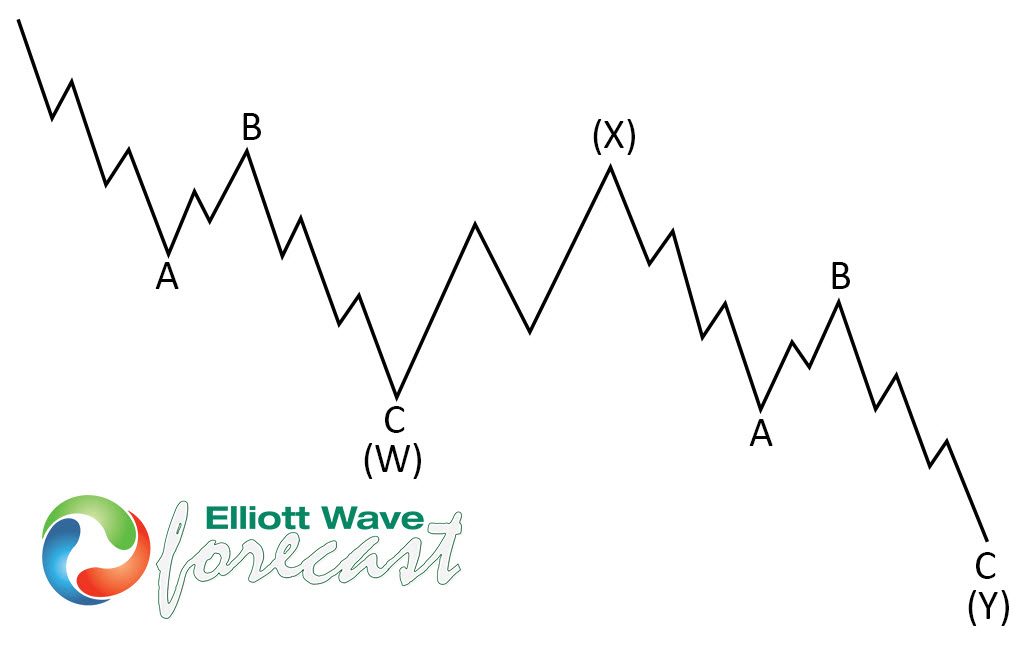
Double three is the most important patern in New Elliott Wave theory and probably the most common pattern in the market these days, also known as 7 swing structure. It’s a very reliable pattern which is giving us good trading entries with clearly defined invalidation levels and target areas. The picture below presents what Elliott Wave Double Three pattern looks like. It has (W),(X),(Y) labeling and 3,3,3 inner structure, which means all of these 3 legs are corrective sequences. Each (W) and (Y) are made of 3 swings , they’re having A,B,C structure in lower degree. Now, let’s […]
August 7, 2016
In this video we will explain how we can identify 5 waves impulsive move, which is the most popular structure and everyone with some knowledge of Elliott Wave are familiar with. However, this 5 waves move do not happen that often in today’s market, compared to the market in the past. So what are some of the criteria used to label moves as 5 impulsive waves? Watch this video and learn how to identify impulsive waves using the 1 hour chart of Corn. Please note that the rule states wave 4 should not overlap with wave 1 but at EWF, […]
August 7, 2016
In this educational video, we will talk about the Elliottwave zigzag structure. Zigzag is a corrective 3 wave move labelled as an ABC. Zigzag is a 5-3-5 Elliott wave structure but zigzag can also be the internal structure of a double three WXY or an internal structure of a triple three WXYZ. What are some of the characteristics of zigzag and the relationship between the swing? For further reading and tips, feel free to read our technical articles at Technical Blogs, check Chart of The Day, or take 14 days FREE trial We offer 24 hour coverage of […]