September 29, 2016
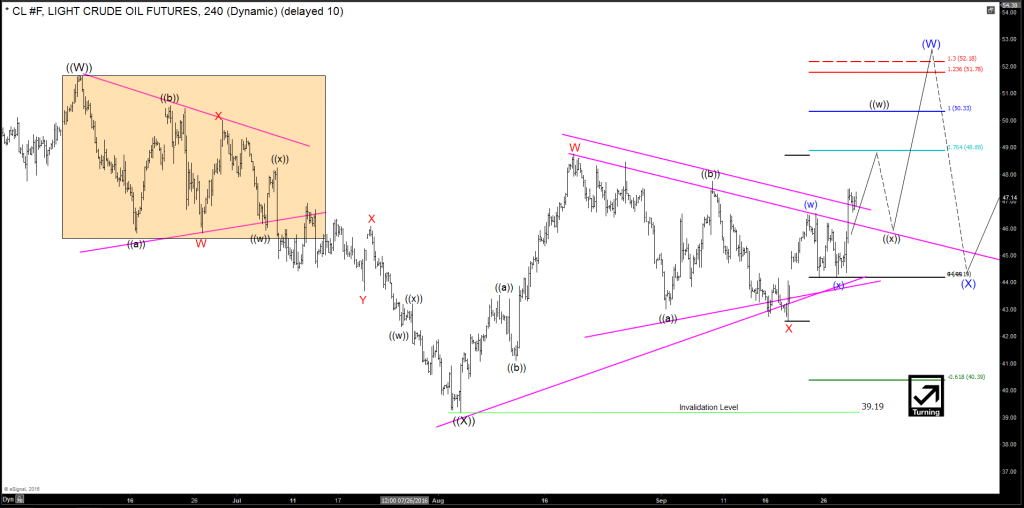
Determining when and where a range has occurred is one of the easiest price patterns to observe: choppy, sideways, and goes nowhere. Once a range bound market has been determined, via Elliottwave analysis or simply observing sideways price action, you can use the tools and methods highlighted in this video blog post to help determine potential breakout targets! The equal legs (100% extension) price measurement tool has many uses, and in this case, it can define a very logical and technical price target for a potential market move (once the market has committed to one direction or the other). CL […]
September 28, 2016
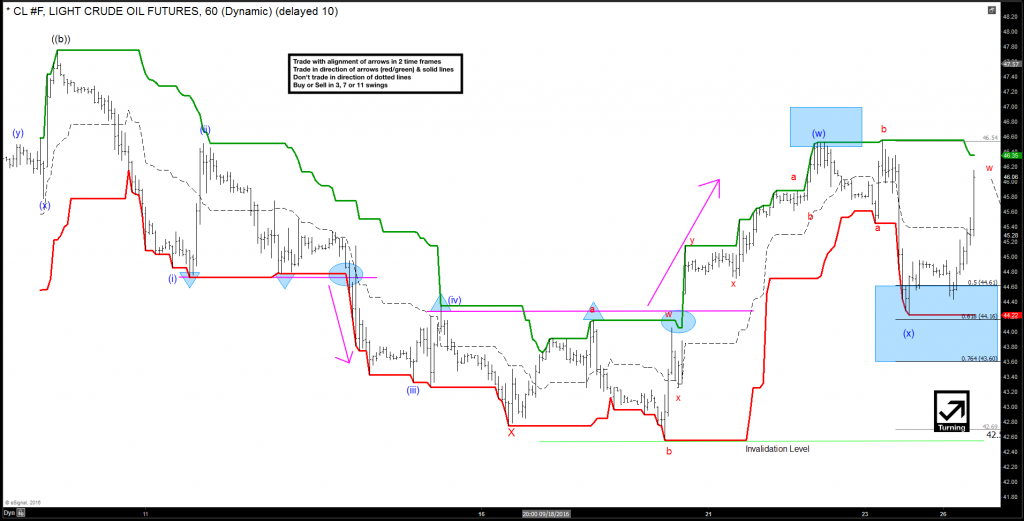
Breakout indicators and breakout trading plans are usually not well discussed in the trading community. They also happen to require specific markets that behave a specific way. A good market for a breakout trading plan is one that has a tendency to trend, without much regression, for sustained periods of time. The periods of time in question are relative to the scale at which you are viewing the market, but the trend needs to be very easily defined. Historically, commodity markets fit the profile for breakout strategies best. They often have long and sustained seasonal trends, which tend to have […]
September 26, 2016
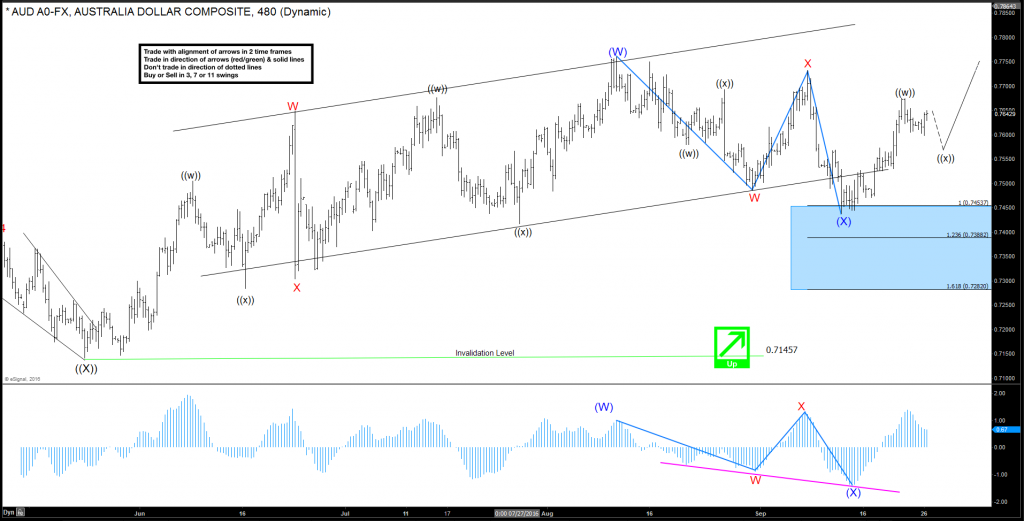
Momentum is one of the most misunderstood indicators in market price action. In this video, I break down how a Price Oscillator can be used as a functional trading indicator for momentum. We take a look at how to tie the indicator into Elliottwave structure for both confirm of the wave structure, as well as provide a reliable indication for price reversal. There are two main uses for the Price Oscillator technical indicator which are highlighted for you to enjoy! AUD/USD – Price Oscillators as a Momentum Indicator 9.26.2016 If you are interested in learning more about trading strategies, developing the trading plan that […]
September 12, 2016
Price measurement is one of the easiest ways to identify trading possibilities. We can use it to identify trend, trend reversals, potential targets, stops, entries and much more. One of my favorite tools is the Fibonacci Extension Price Measurement. This tool is very similar to the Fibonacci Retracement tool in that it utilizes the golden ratio and the Fibonacci sequence to determine pattern in price measurement. This is however, where the similarities end. The Fibonacci Extension tool is used to measure a price projection (as shown in figure A) rather than a retracement (as shown in figure B). Figure […]
August 7, 2016
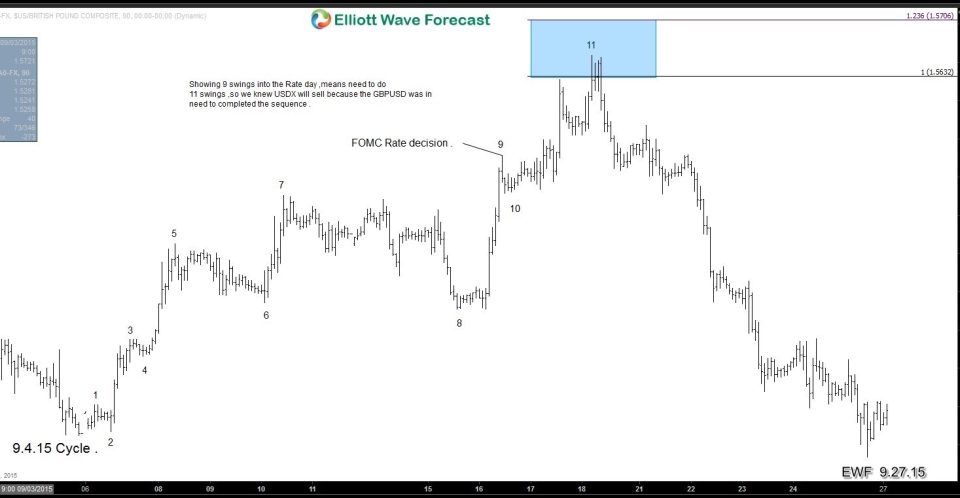
I was thinking today about how I really started taking this blog increasingly social jargon, investor’s education, competitions, contests values , and the like. And among all this remarkable, entertaining, educational, intellectual and I forgot to mention an important fact that every trader knows or should know information. The fact is that any rational analysis on the market will flow back to one of two ways: Either Fundamental or Technical view. Just read the letters and look at the volumes, trends and lines of support or resistance? Well, then you are very focused on technical analysis! Do you base your […]
August 7, 2016
Technical trade vs Fundamental trade A huge debate is which type of trading to follow, many Market participants always find themselves between the dilemmas of which way to follow. Like everything in life, a person needs to have a criteria in order to make a decision and being consistent in the criteria is what makes better decisions in the long run. Trading is a long run when nobody wins all the trades, as well as nobody loses all the trades. Elliott wave Principal is a technical way of trading and have nothing to do with the Fundamental trade. Traders usually try to […]