
Intermarket Correlation – Nat Gas and Crude Oil
September 27, 2016
Price Targets for Range Breakouts in Crude Oil
September 29, 2016Breakout Indicator – Donchian Channels in Crude Oil
Breakout indicators and breakout trading plans are usually not well discussed in the trading community. They also happen to require specific markets that behave a specific way. A good market for a breakout trading plan is one that has a tendency to trend, without much regression, for sustained periods of time. The periods of time in question are relative to the scale at which you are viewing the market, but the trend needs to be very easily defined. Historically, commodity markets fit the profile for breakout strategies best. They often have long and sustained seasonal trends, which tend to have limited regression points (pullbacks, or movements against the trend).
In this article, we will be looking at a 60 min bar chart of the WTI Crude Oil Futures (CL), and two recent breakout scenarios it created (Figure 1). This chart is using a Donchian Channel, seen as a green and red solid line on the chart. Donchian Channels are simply a price indicator designed to display what the most recent (within a set trailing period, here its 25 bars) high and low in price. The indicator is then read by finding multiple highs or lows form at or around the same price level. A markets move above/below the confluence of highs/lows, is the breakout.
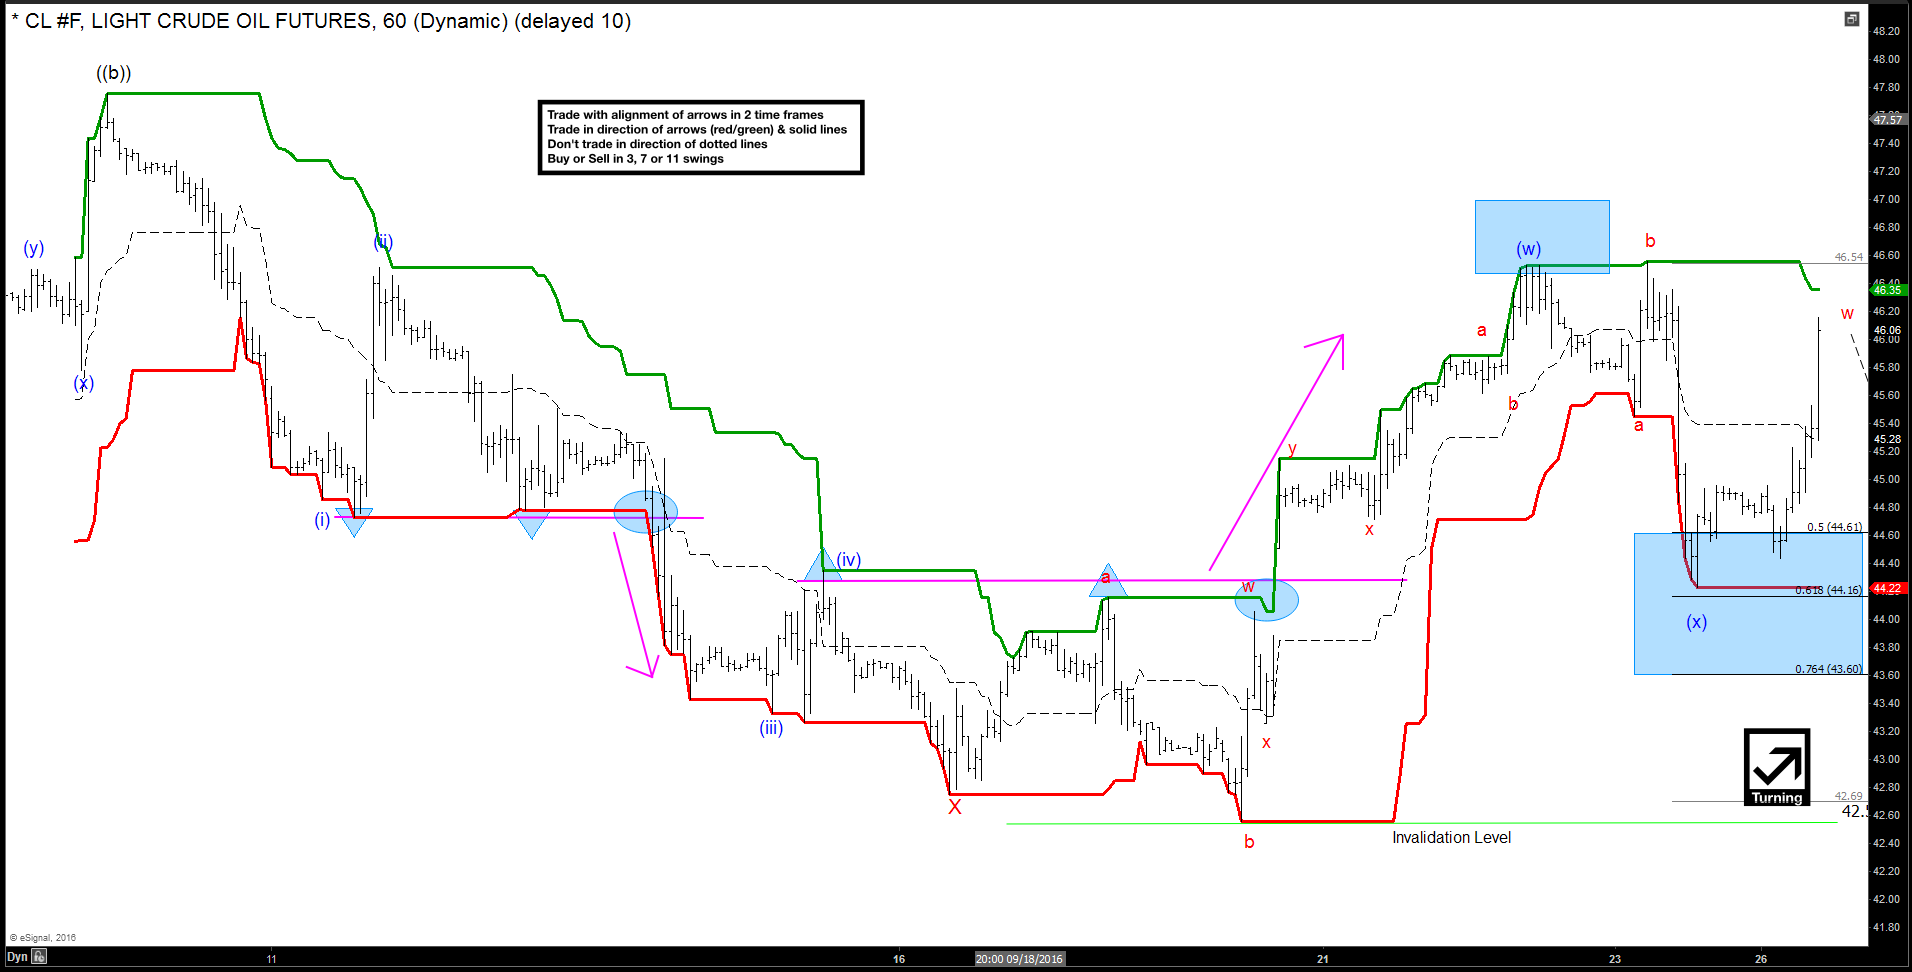
Figure 1 – 60m WTI Crude Oil Futures (CL)
The first breakout scenario occurred when Crude formed a short term low at blue (i). I have placed an upside down triangle to mark this location on the chart. The market then tested this price level a second time, designated by a second upside down triangle. Now we have a setup. Once a price level has been set by the Donchian Channel, and the market tests it a second time (and does not break through), there is now an opportunity to buy/sell the break of that level (in this case sell). The third test broke through this level (first oval) and price declined to new lows. We can capture this move by placing a sell stop just under the channel, and enter when the market punctures through it (triggering the sell order). The exit scenario will be discussed later.
The second breakout scenario occurred after Crude found its low and began to test in the opposite direction (reversed). The green (high) Donchian Channel marker set a new relative high price at blue (iv) and I have placed a blue triangle to denote its location. The market then retested this same price level at red (a), giving us the second test and confirmation of a breakout level. The only difference from our first scenario, is the setup now is to buy stop the market on a break above this level, which occurred at the second blue oval.
Exiting a breakout trade is the last piece of the puzzle, and may be the most argued over aspect of this trading dynamic. It’s important to figure out what you are looking for in such a scenario, and that can change with every factor that is driving market price action in that moment. Most commonly, traders utilize a form of trailing stop and or a hard target price target to exit. There is no right or wrong method to exiting, only that you do not let a winner become a looser.
If you are interested in learning more about breakout strategies, developing the trading plan that is right for you, or just have any questions or comments, feel free to contact the Elliottwave Forecast Educational Team!