
Price Oscillators as a Momentum Indicator
September 26, 2016
Breakout Indicator – Donchian Channels in Crude Oil
September 28, 2016Intermarket Correlation – Nat Gas and Crude Oil
One of the hardest concepts to master as a trader is the idea of correlation in the market. They can be easy to find, but quickly inverse and change rapidly throughout a markets cycle. Simply put, correlations occur when the price movement of one market directly (or indirectly) causes a similar price change in another market. Correlations can be both intermarket (between two markets of different assets) and intra-market (between two markets of the same asset class). For the purposes of this article, we will be discussing only intermarket correlations, as they are the most commonly referred to by speculative traders.
It’s also important to note, hardly any two markets are correlated 100% of the time, but this is a fact that we can use to our advantage as a trader and exploit the constant oscillation between positive and negative correlations that a pair of markets may move between. The changes in degree of a correlation can be attributed to many different factors including: isolated events for one market, inefficient arbitrage between the markets, and in some cases an over or under participation in one side or the other. When it comes to correlations, we really must be able to quantify how, why, and when in order to take advantage of such market movements.
Figure 1 illustrates the Natural Gas futures market (NG) with the WTI Crude Oil futures market (CL) overlaid on a 15 min chart. In this intermarket correlation, we are looking at two fundamentally linked assets. Natural Gas is produced in many of the same fields as Oil, and both being key components of the Energy Commodity sector. Besides these fundamental reasons, these two markets are often bought and sold by commodity funds to create sector indices, leading to a natural arbitrage in their trade.
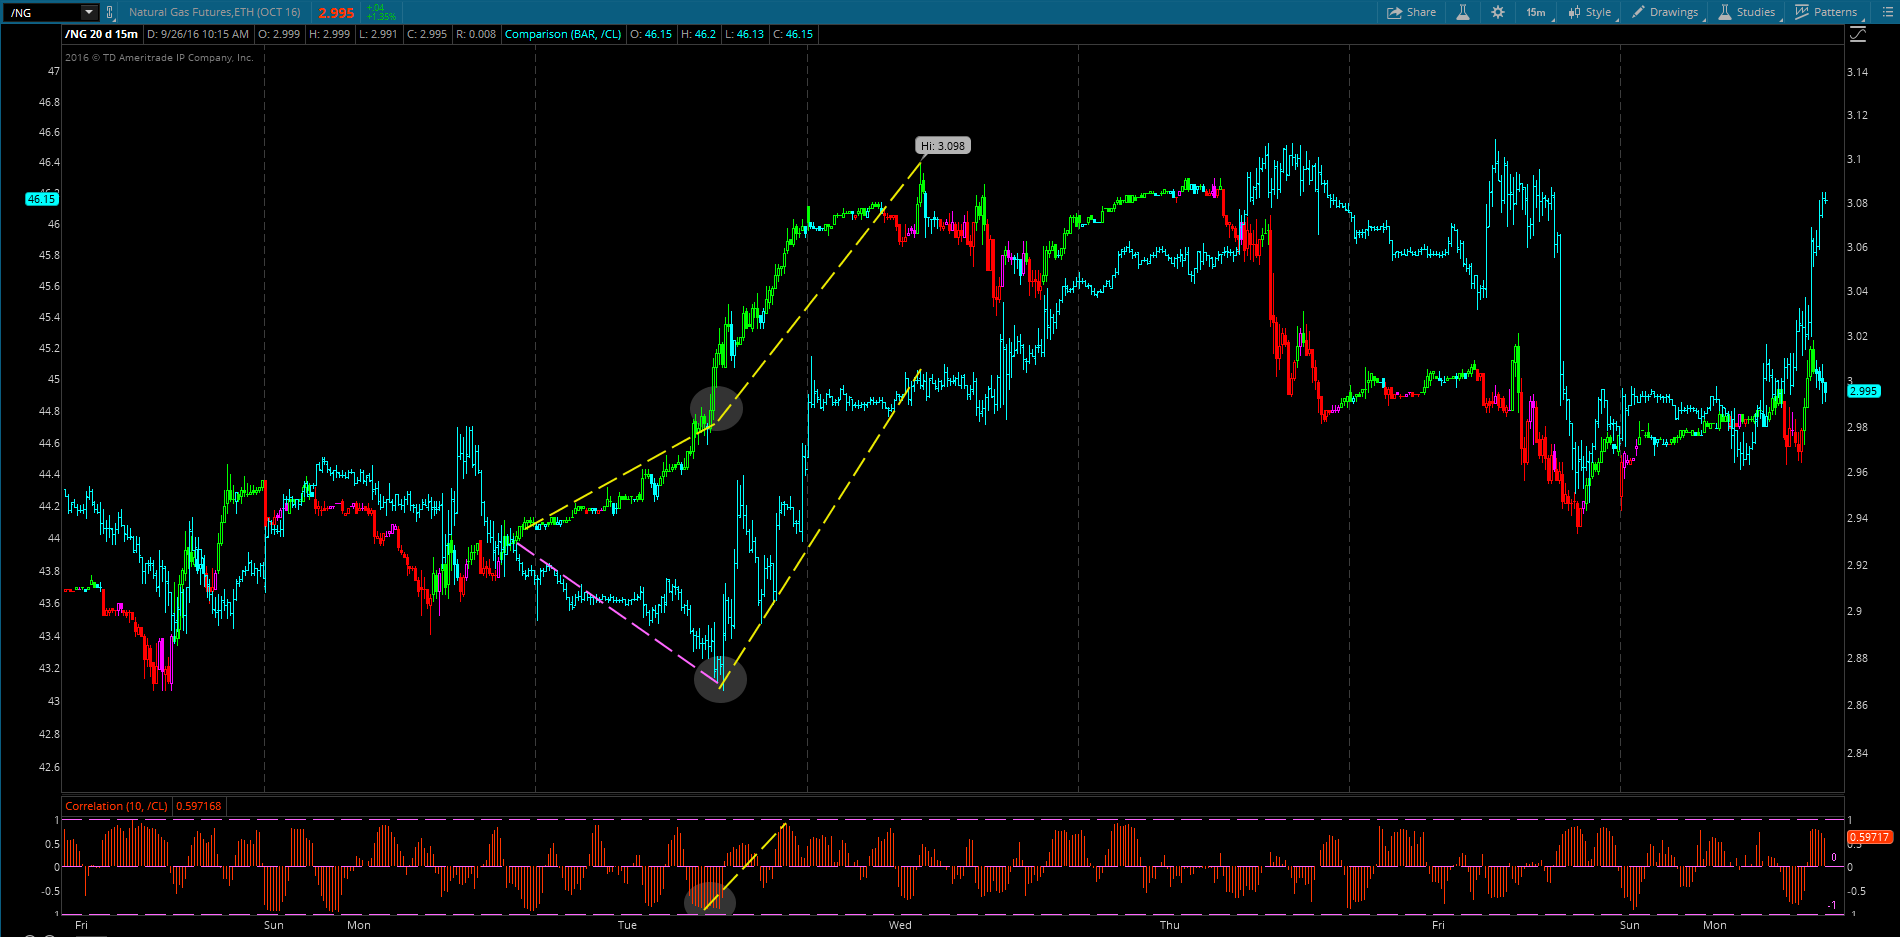
Figure 1. Natural Gas Futures (NG) with WTI Crude Oil (CL) overlaid
In this chart, we see an almost rhythmic dance between the price of both commodities, clearly linked, but sometimes out of sync with each other (and it’s in those moments of divergence that we are able to exploit the differences in price).
I have highlighted the price action in the market (starting on Monday the 19th of September 2016) where the two markets began to diverge from one another. The price in crude oil dropped (purple trend line) while the price in natural gas continued to rise. Seeing two prices move in opposite directions is your first indication there is divergence to be exploited, however, there are a number of indicators you can use to help quantify that divergence and or correlation. The indicator at the bottom of the chart (red histogram) tells us the extent to which the two markets in question are correlated. This market correlation study measures between +1 (being 100% correlated) and -1 (being 100% inversely correlated and moving as opposites), as the price movements of both markets are charted in real time.
We can see the indicator almost reaching -1, bottoming out, and beginning a move back towards +1. At that same time, WTI Crude Oil futures price began to play “catch up” with Natural Gas prices and the two assets returned to a positive +1 correlation. This turn in our market correlation indicator, coupled with a clear observation of divergence in price in the market, gives us a much better confirmation there will be a move in these assets back to being correlated. In this case, Crude Oil which was lagging its counterpart, needed to rally to return to its normal correlated state with Natural Gas.
If you are interested in learning more about trading strategies, developing the trading plan that is right for you, or just have any questions or comments, feel free to contact the Elliottwave Forecast Educational Team!