February 2, 2017

Trading is not about being right or wrong, but it’s about seeing the market in probabilities. Trading is the act of putting one’s hard earned money in the market (at risk of losing it, without fear) under circumstances where one has an edge, a higher change or probability of price action going in one’s favour, while following strict risk & money management rules. Trading is not a quick get-rich scheme. Rather, it is about mastering the technique to preserve one’s capital. When one learns how to manage the risk and preserve capital, profit will come naturally, when when one focuses […]
February 2, 2017

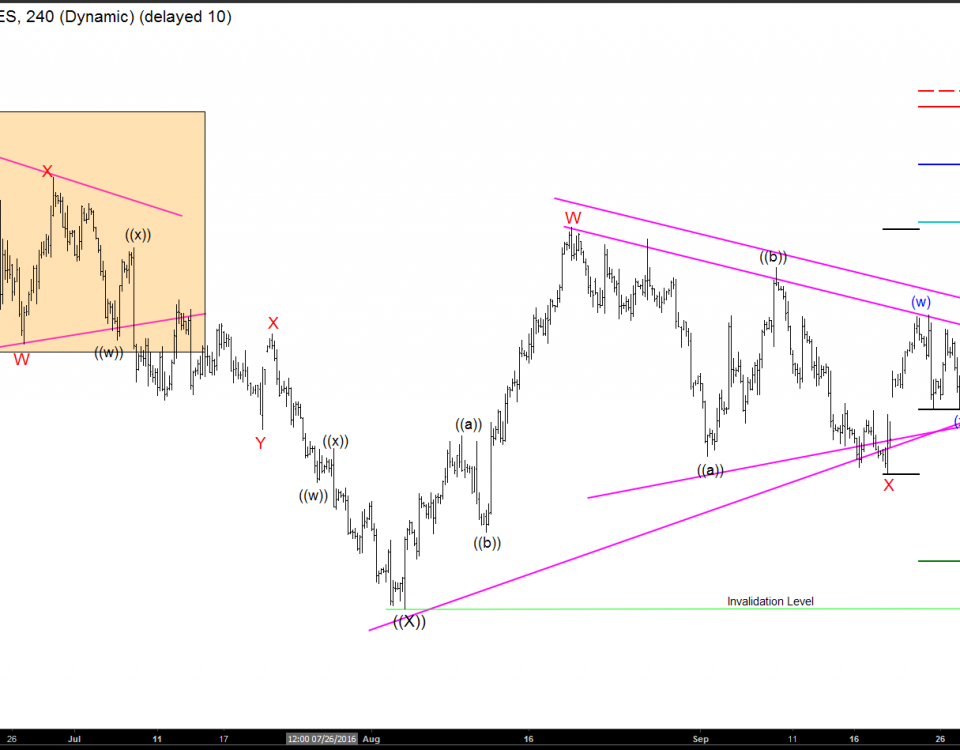
Elliott Wave Theory is a form of technical analysis to analyze financial market cycles and forecast trends. It is named after Ralph Nelson Elliott (1871 – 1948). Inspired by the Dow Theory and by observations found throughout nature. Elliott concluded that the movement of the stock market could be predicted by observing and identifying a repetitive pattern of waves. Elliott noted from his observation that movement in the direction of the trend is always in five waves, labelled as 1, 2, 3, 4, and 5. This is usually called motive wave. Movement against the trend is always in three waves […]
September 29, 2016
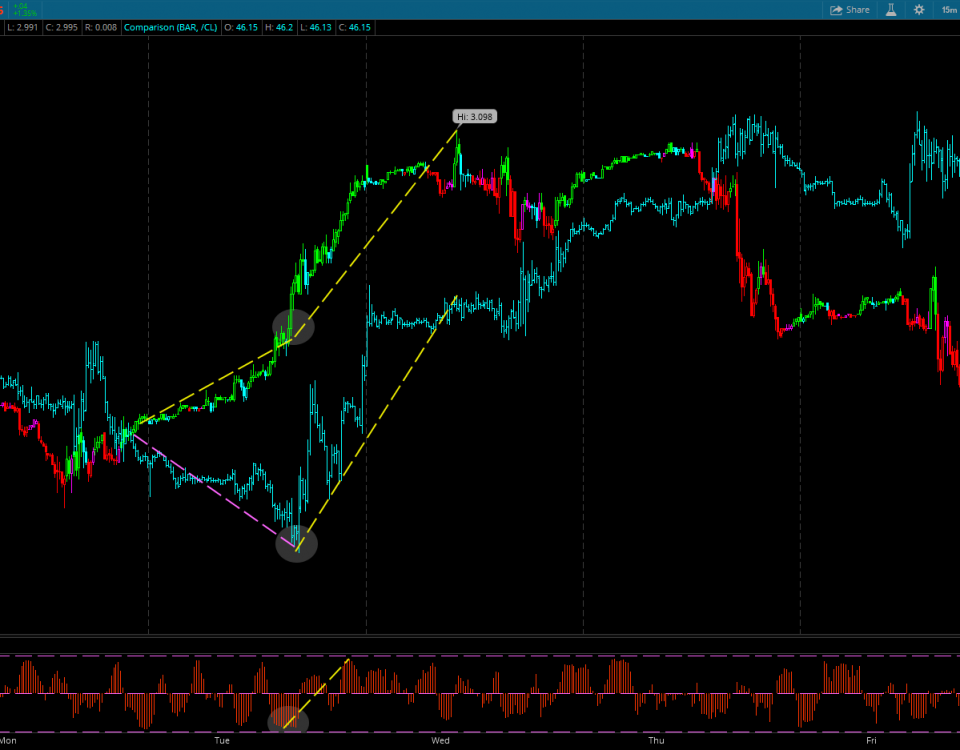
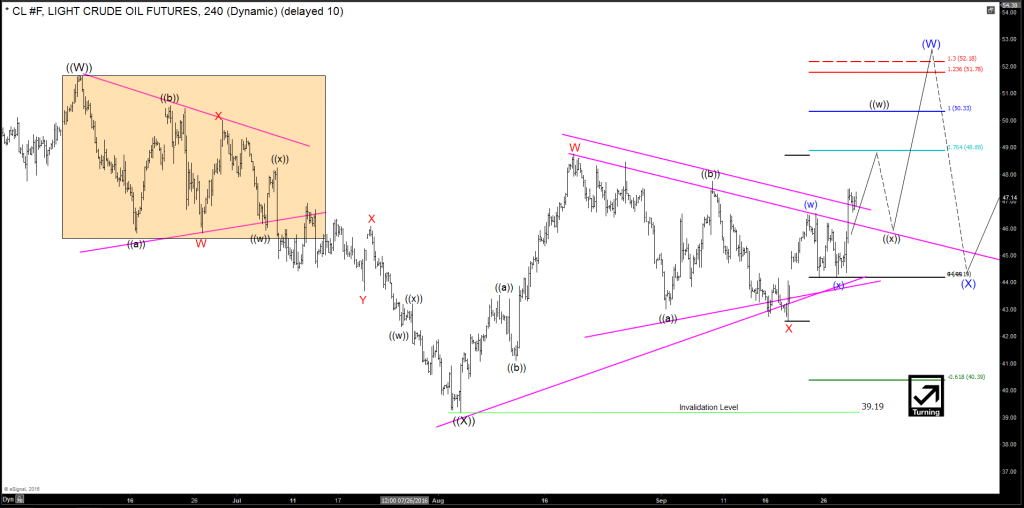
Determining when and where a range has occurred is one of the easiest price patterns to observe: choppy, sideways, and goes nowhere. Once a range bound market has been determined, via Elliottwave analysis or simply observing sideways price action, you can use the tools and methods highlighted in this video blog post to help determine potential breakout targets! The equal legs (100% extension) price measurement tool has many uses, and in this case, it can define a very logical and technical price target for a potential market move (once the market has committed to one direction or the other). CL […]
September 28, 2016
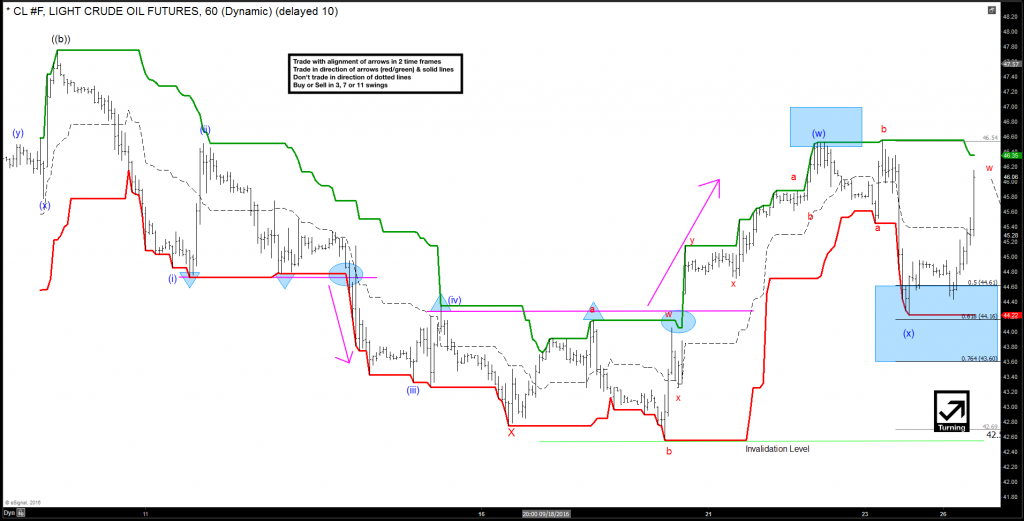
Breakout indicators and breakout trading plans are usually not well discussed in the trading community. They also happen to require specific markets that behave a specific way. A good market for a breakout trading plan is one that has a tendency to trend, without much regression, for sustained periods of time. The periods of time in question are relative to the scale at which you are viewing the market, but the trend needs to be very easily defined. Historically, commodity markets fit the profile for breakout strategies best. They often have long and sustained seasonal trends, which tend to have […]
September 27, 2016
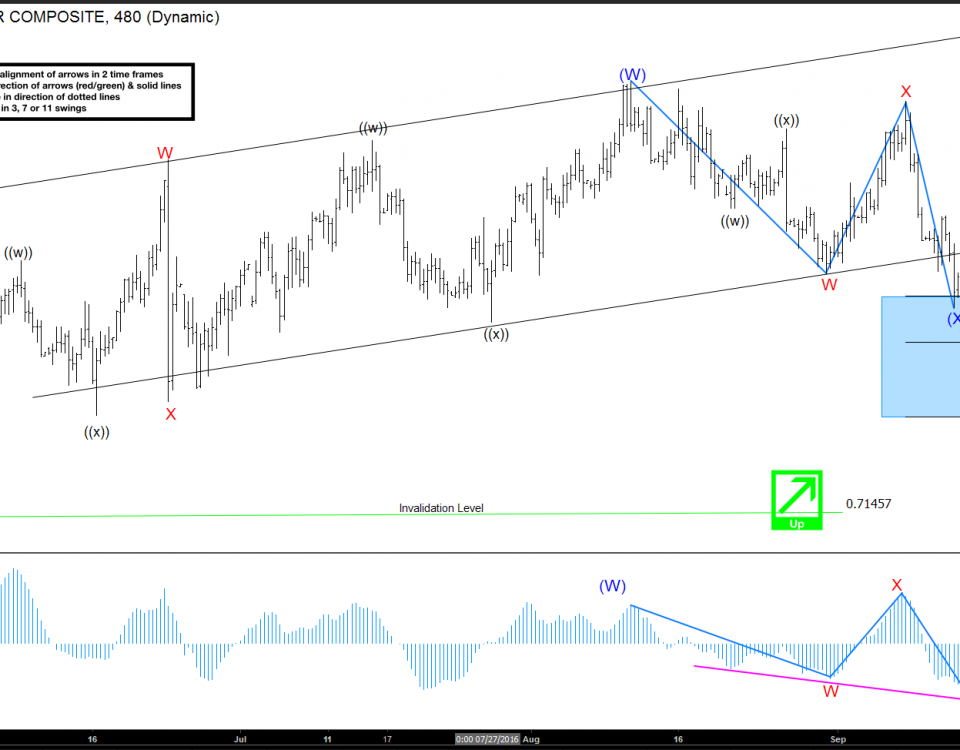
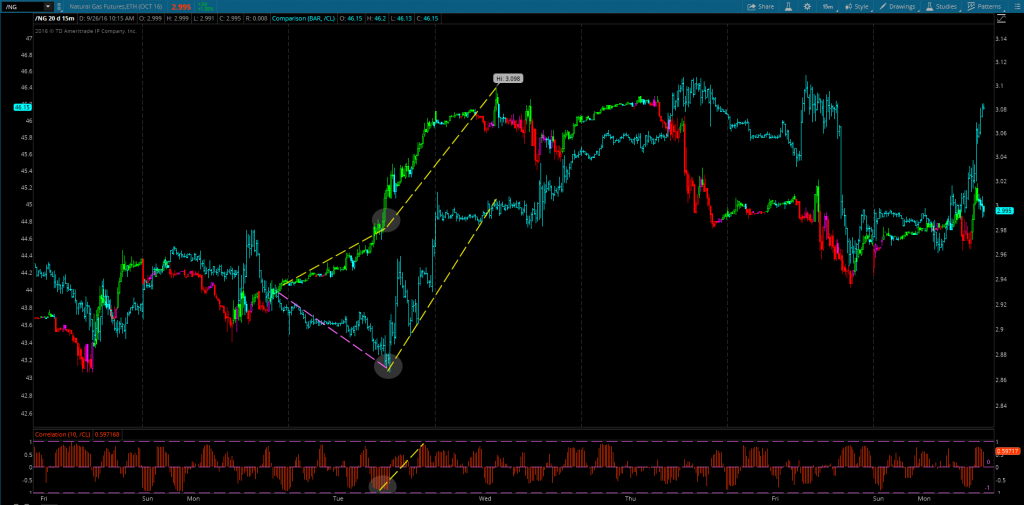
One of the hardest concepts to master as a trader is the idea of correlation in the market. They can be easy to find, but quickly inverse and change rapidly throughout a markets cycle. Simply put, correlations occur when the price movement of one market directly (or indirectly) causes a similar price change in another market. Correlations can be both intermarket (between two markets of different assets) and intra-market (between two markets of the same asset class). For the purposes of this article, we will be discussing only intermarket correlations, as they are the most commonly referred to by speculative […]
September 26, 2016
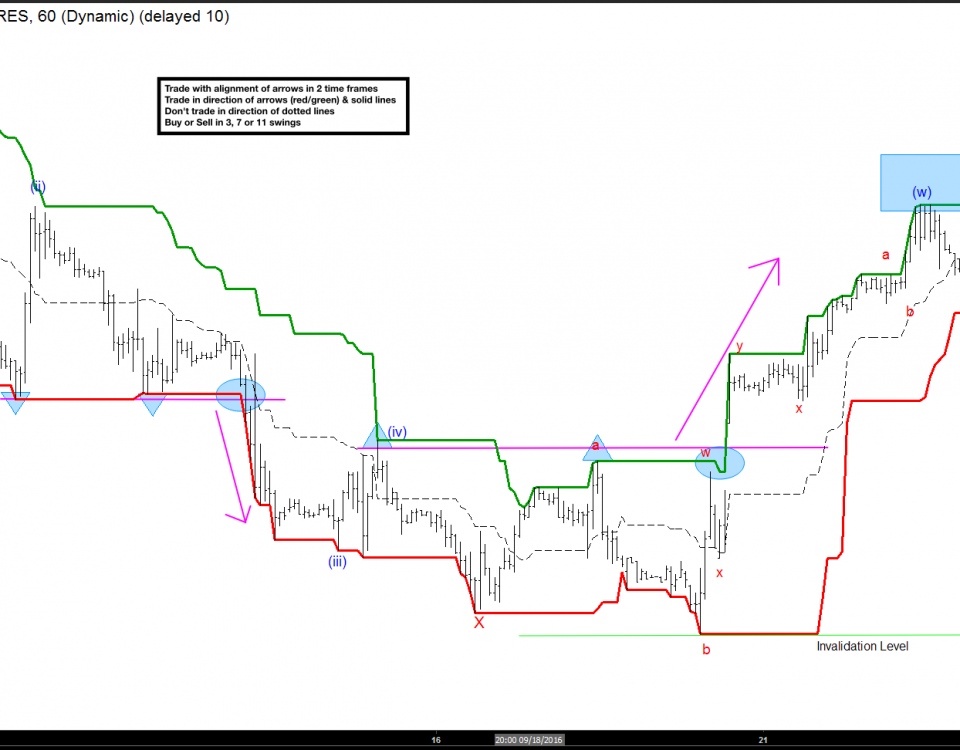
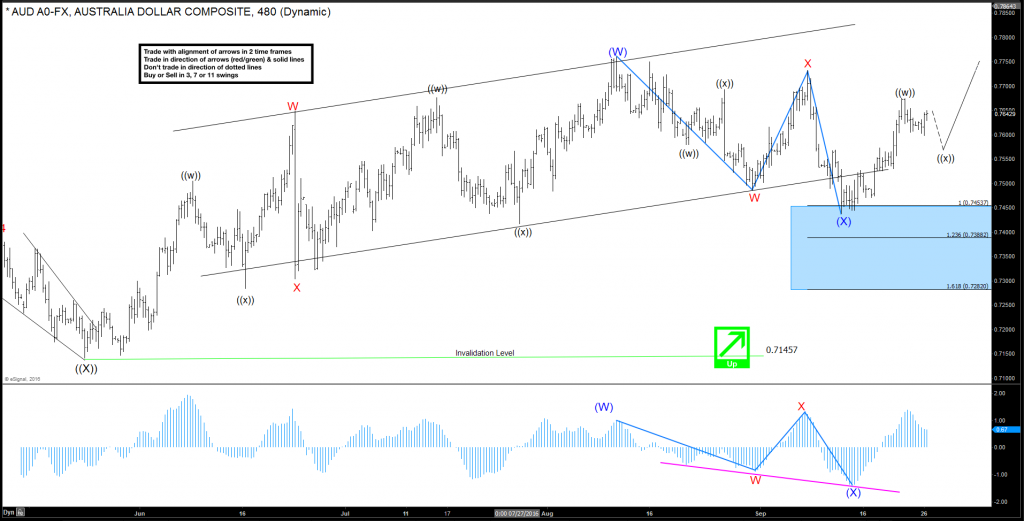
Momentum is one of the most misunderstood indicators in market price action. In this video, I break down how a Price Oscillator can be used as a functional trading indicator for momentum. We take a look at how to tie the indicator into Elliottwave structure for both confirm of the wave structure, as well as provide a reliable indication for price reversal. There are two main uses for the Price Oscillator technical indicator which are highlighted for you to enjoy! AUD/USD – Price Oscillators as a Momentum Indicator 9.26.2016 If you are interested in learning more about trading strategies, developing the trading plan that […]